“Yvonne’s Yacht” is introduced for you to master the balance sheet analysis. The Yacht visualizes the numbers – which don’t lie – and turns into vivid figures to memorize and analyze better.
What is Yvonne’s Yacht?
The accounts on the “yacht” and how it is positioned are matched to the balance sheet structure.
With assets on the left side and the liabilities and equity on the right side. The width of the boxes represents the size of the account in monetary value terms.
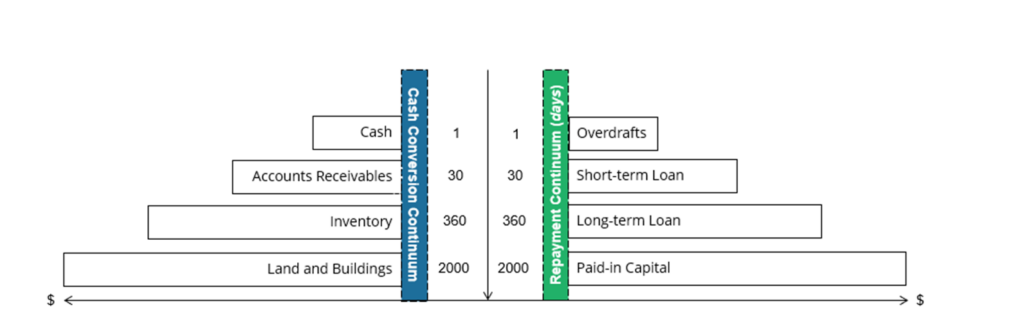
- Length/width of horizontal bar is relative to dollar size of account
- Position of bar along the continuums is based on cash conversion days and days to repayment
- Dynamic view of the balance sheet
4 Shapes of Yvonne’s Yacht
There are generally 4 typical shapes. 2 questions are always asked to characterize them:
(1) About stability: Can the company survive during a bad time? [ Review Equity Buffer, to prepare for your answer. ]
(2) About efficiency: How good can the company generate cash (which is future equity)?
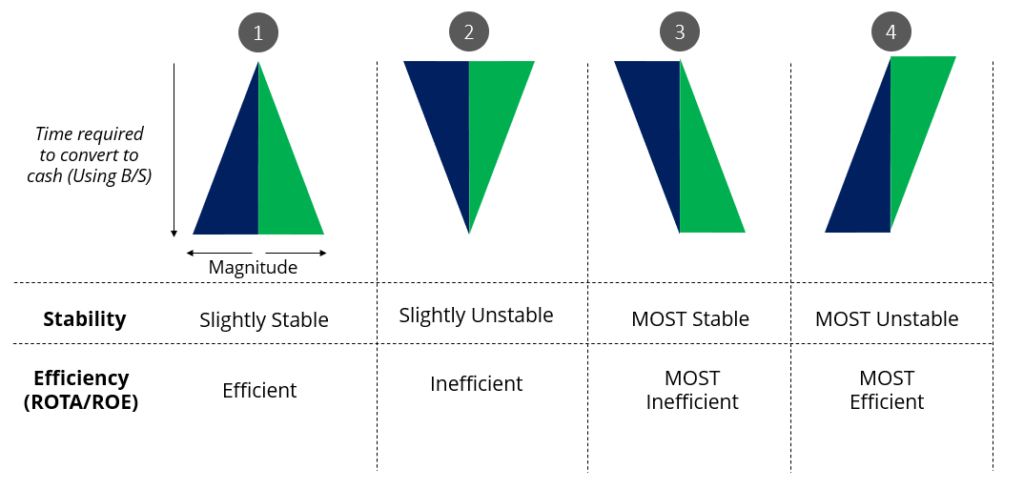
1st Shape
Assets in the left match perfectly to the capital in the right, and the non-current assets & non-current liabilities and equity are dominating rather than the current portion. Heavy-asset companies like real estate, usually own such shape.
- Stability: Slightly stable. Companies have a small amount of cash, thus less likely to tide over liquidity challenges which require huge piles of $$$. Meanwhile, companies have strong equity buffer and relatively small current debt which requires immediate repayment – so less likely for liquidity challenges to happen.
- Efficiency: Efficient. Assets consist of more working capital with even more PP&E (Property, Plant, and Equipment) which are all generating revenues.
2nd Shape
Just like 1st shape, assets are matching capital. However, the current portion dominates the non-current. Light asset companies including trading companies, Internet companies (e.g. e-commerce), etc. tend to have such shape.
- Stability: Slightly unstable. Even though the company has a large cash position, the maturing debt that requires immediate repayment is huge.
- Efficiency: Inefficient. The company simply has a big chunk of sitting cash. Fewer assets are put into generating profits.All about the internet companies
3rd Shape
Structural mismatch happens: more current assets vs. more non-current capital means long-term capital is financing short-term assets. Companies operating in a very-inefficient way or in a transition period temporarily usually have such shape.
- Stability: Most stable. Companies have a strong cash position while minimal ST debt demands immediate payback!
- Efficiency: Most Inefficient. As we all know, LT capital is more expensive than ST and is designed to finance LT assets. How can you be efficient when you crack a nut using a sledgehammer?! It is also quite BAD especially for debt holders (usually banks), as the company misuses the LT debt thus generating less revenue for repayment than expected.
- Cracking a nut using a sledgehammer
4th Shape
Structural mismatch happens but in a different way: more non-current assets vs more current liabilities. Companies holding a “bridge loan” temporarily usually own such shape.
- Stability: Most unstable. Quite clear – imagine the bank calls the payback of loan, the company just don’t have cash for them.
- Efficiency: Most efficient. From the company owner’s perspective, they use cheaper ST loans to finance LT assets – is there anything better than that? It’s just destructive to the debt holders (banks) as the chances to have their money back are minimal!