JPMorgan Chase Balance Sheet Summary as of December 31, 2023 (in millions)
| Assets | Amount | Liabilities and Stockholders’ Equity | Amount |
| Assets | 3,875,393 | Liabilities | 3,547,515 |
| Cash and due from banks | 28,271 | Short-term borrowings | 64,628 |
| Deposits with banks | 539,512 | Brokerage payables | 161,960 |
| Federal funds sold and securities purchased under resale agreements | 259,813 | Other payables and liabilities | 128,347 |
| Securities borrowed | 70,086 | Long-term debt | 3,053,733 |
| Trading assets | 612,968 | Beneficial interests issued by consolidated VIEs | 23,020 |
| Available-for-sale securities | 409,994 | Other liabilities | 263 |
| Held-to-maturity securities | 426,461 | Total Liabilities | 3,547,515 |
| Loans | 1,183,037 | Stockholders’ Equity | 327,878 |
| Premises and equipment | 16,881 | Preferred stock | 27,404 |
| Goodwill | 52,634 | Common stockholders’ equity | 300,474 |
| Other intangible assets | 3,225 | Total Stockholders’ Equity | 327,878 |
| Other assets | 59,136 | Total Liabilities and Stockholders’ Equity | 3,875,393 |
Important Notes:
- Loans: This category includes consumer loans (excluding credit cards), credit cards, and wholesale loans.
- Available-for-sale securities and Held-to-maturity securities: These figures represent the amortized cost, net of the allowance for credit losses.
- Trading assets: Includes assets pledged as collateral.
- Beneficial interests issued by consolidated VIEs: Refers to liabilities related to Variable Interest Entities (VIEs) that JPMorgan Chase consolidates.
- Other liabilities: This includes items like credit card rewards liability and other miscellaneous payables.
This summary table provides a simplified view of JPMorgan Chase’s balance sheet for 2023. For a more detailed understanding, please refer to the full financial statements in the provided source documents.
JPMorgan Chase Staff Numbers Over 5 Years
| Year | Staff Number | Change | Explanation |
| 2019 | 248,325 | Starting point | |
| 2020 | 255,349 | 7,024 | Additional employees in technology & operations, and front office |
| 2021 | 271,025 | 15,674 | Increase in global workforce |
| 2022 | 293,723 | 22,698 | Additional employees in technology & operations, and front office |
| 2023 | 309,926 | 16,203 | Growth in front office, operations, and technology, plus First Republic acquisition |
Explanation of Changes:
- The consistent trend across the years is the growth in staff numbers, primarily driven by hiring in technology, operations, and front office roles.
- In 2021, the acquisition of First Republic Bank also contributed to the increase in staff numbers.
Note: This table focuses on the overall staff numbers. The sources also provide breakdowns of staff numbers by region, line of business, and diversity categories. If you’re interested in those details, please let me know and I can provide them.
JPMorgan Chase 2023 Income Statement Details by Line of Business
The sources provide sufficient information to create an expanded income statement for JPMorgan Chase for 2023. This statement will present details for each primary business segment, as well as for the consolidated “Corporate” segment, which covers various central functions and initiatives. All amounts are in millions of US dollars.
| Line Item | Consumer & Community Banking | Corporate & Investment Bank | Commercial Banking | Asset & Wealth Management | Corporate | Total |
| Net Revenue | 70,148 | 48,807 | 15,546 | 17,748 | (5,901) | 158,104 |
| Noninterest revenue | 15,118 | 40,315 | 3,494 | 13,560 | 6,350 | 78,837 |
| Net interest income | 55,030 | 8,492 | 12,052 | 6,267 | (12,251) | 79,267 |
| Provision for Credit Losses | 6,899 | 1,158 | 1,268 | 128 | — | 9,320 |
| Noninterest Expense | 34,819 | 27,087 | 4,719 | 11,829 | 8,719 | 87,172 |
| Income Before Taxes | 28,430 | 20,562 | 9,561 | 5,791 | (14,670) | 60,674 |
| Income tax benefit | (7,198) | — | — | (1,426) | 10,684 | 2,060 |
| Net Income | 21,232 | 20,562 | 9,561 | 4,365 | (4,006) | 51,714 |
| Equity in undistributed net income of subsidiaries | — | — | — | — | 1,867 | 1,867 |
| Total Income | 21,232 | 20,562 | 9,561 | 4,365 | (2,139) | 53,581 |
Key Insights:
- Revenue Drivers: Net interest income remains a significant revenue source across most segments, particularly for Consumer & Community Banking, driven by higher interest rates. Noninterest revenue is substantial for the Corporate & Investment Bank, reflecting strong performance in areas like investment banking and trading.
- Credit Loss Impact: The provision for credit losses, while higher than in 2021, is notably lower than in 2020, indicating improved economic conditions and potentially more conservative lending practices.
- Segment Performance: All segments, except for Corporate, reported positive net income in 2023, suggesting a strong overall performance for JPMorgan Chase. The Corporate segment’s negative net income is likely due to various factors, such as investments in technology, regulatory costs, and other central expenses not allocated to specific business lines.
- First Republic Acquisition: In 2023, JPMorgan Chase acquired First Republic Bank. Some of the impacts of this acquisition are reflected in the numbers above. However, the sources do not provide a precise breakdown of the financial contributions from First Republic for the entire year.
Note:
- This expanded income statement offers a more detailed view than the previous summary table, providing greater insight into the performance of individual business segments.
- The information is based on the data available in the sources provided. For a complete understanding of JPMorgan Chase’s financials, it’s recommended to review the full 10-K reports.
JPMorgan Chase 2023 Balance Sheet Breakdown by Line of Business
The sources do not provide a fully detailed balance sheet broken down by line of business for 2023. However, they offer select pieces of information that can be used to partially construct such a breakdown.
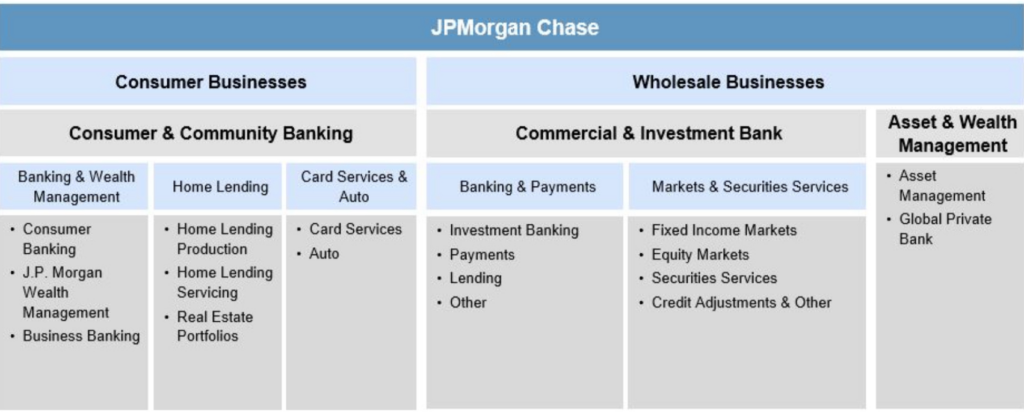
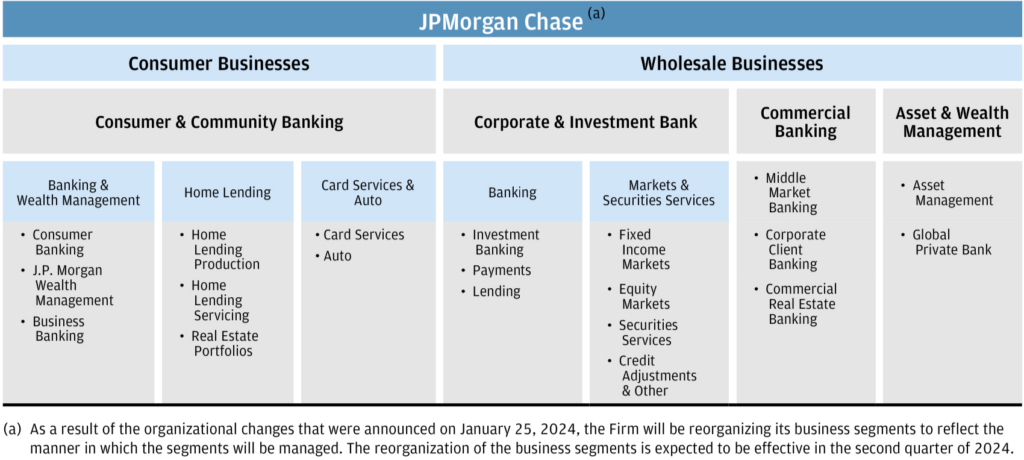
First, let’s identify the key line of businesses for JPMorgan Chase:
- Consumer & Community Banking (CCB): Serves consumers and businesses with products including deposit accounts, credit cards, mortgages, and auto loans.
- Corporate & Investment Bank (CIB): Provides investment banking, financial market services, and treasury and securities services to corporations, governments, and institutional investors.
- Commercial Banking: Offers a range of financial solutions to businesses, including lending, treasury services, investment banking, and asset management.
- Asset & Wealth Management (AWM): Provides investment and wealth management services to individuals, institutions, and foundations.
The following table pieces together information from various parts of the sources to give a partial view of the 2023 balance sheet:
| Line of Business | Balance Sheet Item | Amount (in millions) | Source |
| CCB | Average Deposits | 1,126,552 | |
| CCB | Average Loans | 468,262 | |
| CCB | Equity | 54,349 | |
| CIB | Average Deposits | 728,537 | |
| CIB | Average Loans | 58,093 | |
| CIB | Total Client Deposits and Other Third-Party Liabilities | 645,074 | |
| Commercial Banking | Average Deposits | 267,758 | |
| Commercial Banking | Loans at Period-End | 278,208 | |
| Commercial Banking | Equity | 29,507 | |
| AWM | Average Deposits | 216,178 | |
| AWM | Loans at Period-End | 227,929 | |
| AWM | Equity | 17,000 | |
| Consolidated | Total Assets | 3,935,866 | |
| Consolidated | Total Liabilities | 3,588,088 | |
| Consolidated | Total Stockholders’ Equity | 347,778 |
Important Notes:
- Incomplete Data: This table only captures a subset of the balance sheet items. A comprehensive view would include many other assets and liabilities for each line of business.
- Varying Metrics: The table uses a mix of period-end and average balances, as this is how the information was presented in the source documents.
- Corporate Segment: Details for the Corporate segment, which handles central functions, are not broken out separately in the source. These figures are embedded in the consolidated amounts.
- First Republic Impact: The data for 2023 includes the impact of the First Republic Bank acquisition. The specific contributions of First Republic’s assets and liabilities are not detailed.
To obtain a complete and fully reconciled balance sheet by line of business, you would need to consult JPMorgan Chase’s full financial statements and notes, or possibly reach out to the company directly for specific breakdowns.
Top Countries by Exposure (Excluding the U.S.)
The sources provide information about JPMorgan Chase’s country risk exposure based on its internal risk management approach. This approach attributes exposure to the country where the counterparty’s largest proportion of assets or revenue is located.
The data highlights the following countries as JPMorgan Chase’s most significant exposures, in descending order of importance as of December 31, 2023:
- Germany: $84.8 billion
- United Kingdom: $77.1 billion
- Japan: $36.0 billion
- Australia: $18.3 billion
- Brazil: $16.7 billion
- Canada: $16.0 billion
- China: $14.0 billion
- Switzerland: $10.9 billion
- France: $10.1 billion
- Singapore: $9.8 billion
- India: $9.7 billion
- Mexico: $8.2 billion
- Belgium: $8.0 billion
- South Korea: $7.8 billion
- Saudi Arabia: $7.7 billion
- Spain: $6.3 billion
- Italy: $6.0 billion
- Netherlands: $5.6 billion
- Malaysia: $4.2 billion
- Luxembourg: $4.0 billion
Key Considerations:
- Excluding U.S.: This list specifically focuses on JPMorgan Chase’s exposures outside of the United States. The U.S. is likely its single largest market, but the sources don’t explicitly quantify this.
- Exposure Fluctuations: Country exposures can change significantly over time due to factors like client activity, market conditions, and the firm’s strategic decisions.
- Internal Methodology: The rankings are based on JPMorgan Chase’s internal country risk management approach. This methodology might differ from how other institutions assess country risk.
- Risk Perception: A high exposure doesn’t necessarily indicate a negative view of a country’s creditworthiness. JPMorgan Chase manages risk across its global portfolio, and higher exposures could simply reflect a larger volume of business in a particular country.
Additional Context from Sources:
- EU Presence: The sources mention the establishment of Intermediate Parent Undertakings (IPUs) in the EU [corp-10k-2023.pdf], indicating a significant commitment to the European market.
- International Growth Initiatives: The sources highlight initiatives like Chase U.K. and Nutmeg in the United Kingdom and a stake in C6 Bank in Brazil. These initiatives suggest a focus on expanding operations in specific international markets.
Limitations of the Sources:
- Focus on Risk: The sources primarily focus on country risk exposure, not the full extent of JPMorgan Chase’s operational footprint. It’s possible that the firm operates in countries beyond those listed based on exposures.
- Lack of Granularity: The sources don’t specify the types of business activities driving the exposure in each country (e.g., lending, trading, investment banking).
To gain a more comprehensive understanding of JPMorgan Chase’s global operations, you might need to explore additional resources such as:
- JPMorgan Chase’s website: The company’s website might list its global locations or provide overviews of its business activities in different regions.
- Annual Reports: The full annual reports could contain more detailed information about international operations and business segment performance in various countries.
- News Articles and Industry Reports: Financial news outlets and industry analysts often publish reports about major financial institutions’ global activities, which might provide insights into JPMorgan Chase’s specific focus areas.
Consolidated statements of income
Revenue
Investment banking fees
Principal transactions
Lending- and deposit-related fees Asset management fees Commissions and other fees Investment securities losses Mortgage fees and related income Card income
Other income
Noninterest revenue
Interest income Interest expense Net interest income Total net revenue
Provision for credit losses
Noninterest expense
Compensation expense
Occupancy expense
Technology, communications and equipment expense Professional and outside services
Marketing
Other expense
Total noninterest expense
Income before income tax expense
Income tax expense
Net income
Net income applicable to common stockholders
Net income per common share data
Basic earnings per share
Diluted earnings per share
Weighted-average basic shares Weighted-average diluted shares
$
6,519 24,460 7,413 15,220 6,836
(3,180) 1,176 4,784 5,609
68,837 170,588 81,321 89,267 158,104
9,320
46,465 4,590 9,246
10,235 4,591 12,045 87,172 61,612 12,060 49,552 47,760
16.25 16.23
2,938.6 2,943.1
$
6,686 19,912 7,098 14,096 6,581
(2,380) 1,250 4,420 4,322
61,985 92,807 26,097 66,710
128,695 6,389
41,636 4,696 9,358
10,174 3,911 6,365
76,140 46,166 8,490 37,676 35,892
12.10 12.09
2,965.8 2,970.0
$
13,216 16,304 7,032 14,405 6,624
(345) 2,170 5,102 4,830
69,338 57,864 5,553 52,311 121,649
(9,256)
38,567 4,516 9,941 9,814 3,036 5,469
71,343 59,562 11,228 48,334 46,503
15.39 15.36
3,021.5 3,026.6
Year ended December 31, (in millions, except per share data)