Using your own money to finance the business
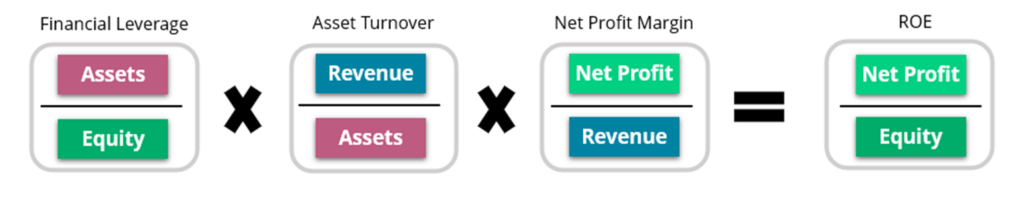
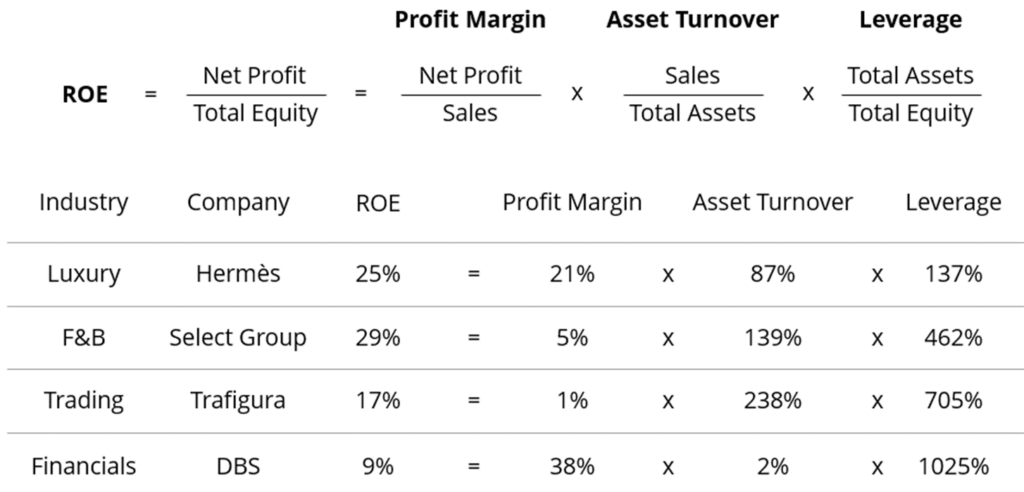
Return on Equity (ROE)
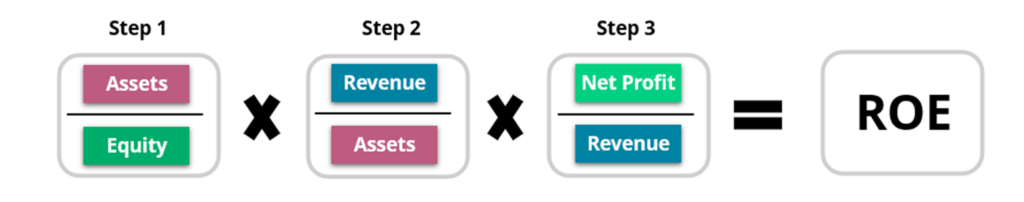
Step 1 : Financial Leverage
- In this unlevered scenario, is the ratio intentional or unintentional (A deliberate decision by the owner?)
Step 2 : Asset Turnover
- Should this be as high or low as possible?
- Can it go below 1x?
- Is this within the control of the business or outside the business owner’s control?
Step 3 : Net Profit Margin
- Is this within the control of the business or outside the business owner’s control?
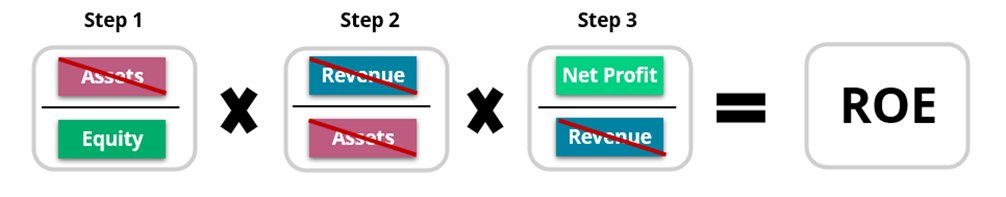
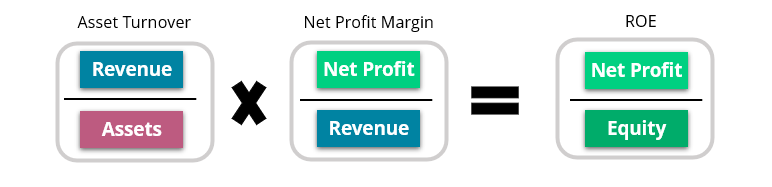
Therefore, after cancelling out the above items, we can derive our (ROE = Net Profit / Equity) formula.
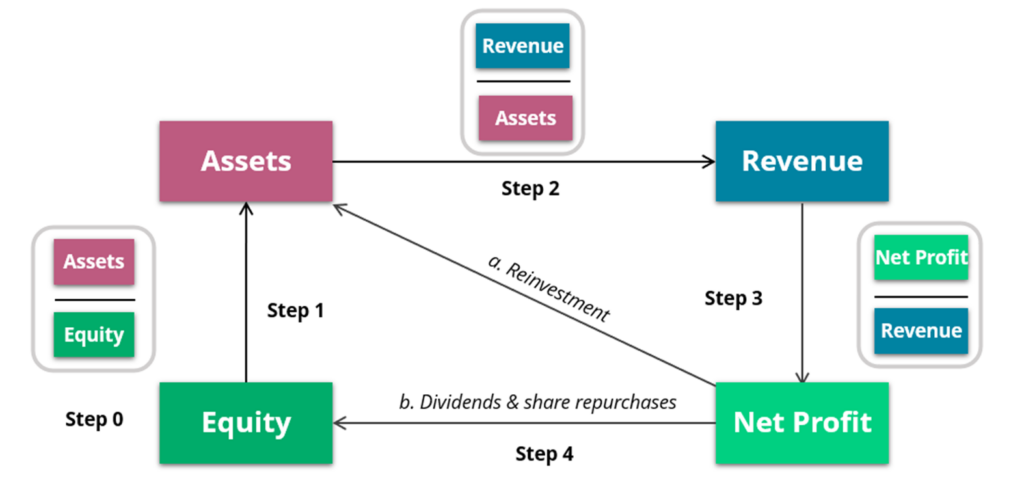
When you only use your own money…
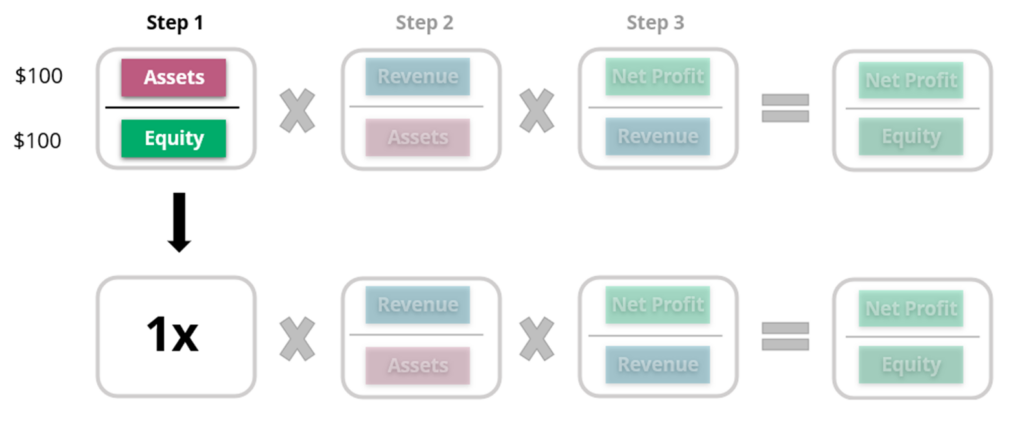
For example, let’s utilize the figures from our previous example on Capital Life Cycle.
Assuming you funded your business using only your own equity of $100, you would have $100 of cash. You would then utilize that money to buy $100 of assets for your business.
Therefore, we can determine that our financial leverage is at 1x when you are using your own money to fund the business. Again, when we times something by 1 it will return the same number. As such, how would this affect our Return-on-Asset ratio in this scenario?
Implication on ROE and ROA
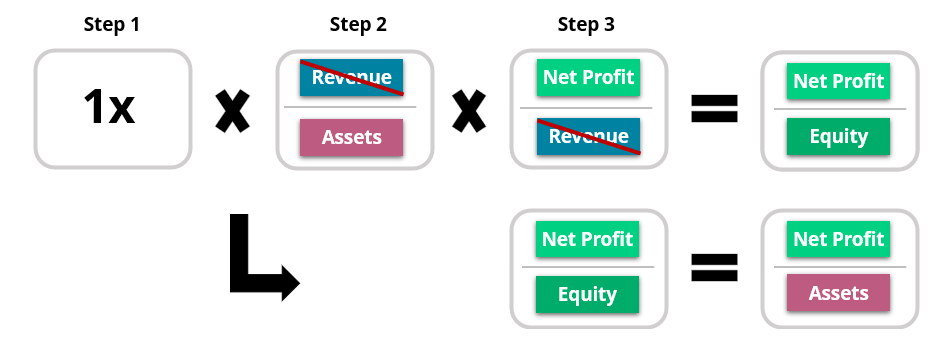
When funded by your own money,
We can determine that our ROE = ROA ratio based on the formula above.
DuPont ROE – Further decomposition
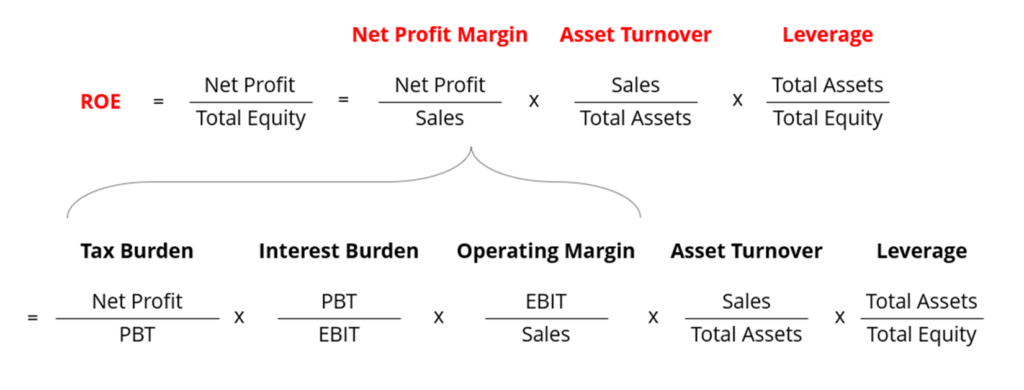
3 Drivers of ROE
Using the formula above , we can see that the ROE can be driven by three drivers :
- Net Profit Margin
- Asset Turnover
- Financial Leverage
As an example, we will be maintaining the ROE at 10% to illustrate how an increase component would affect the ROE figures , starting with your Net Profit Margin. This would allow you to determine which component is driving the ROE figures for your business.
Driver 1: Increase Net Profit Margin
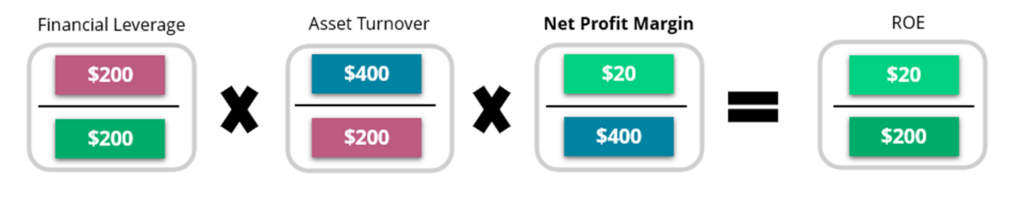
For the following example, we will utilize the figures as shown above.
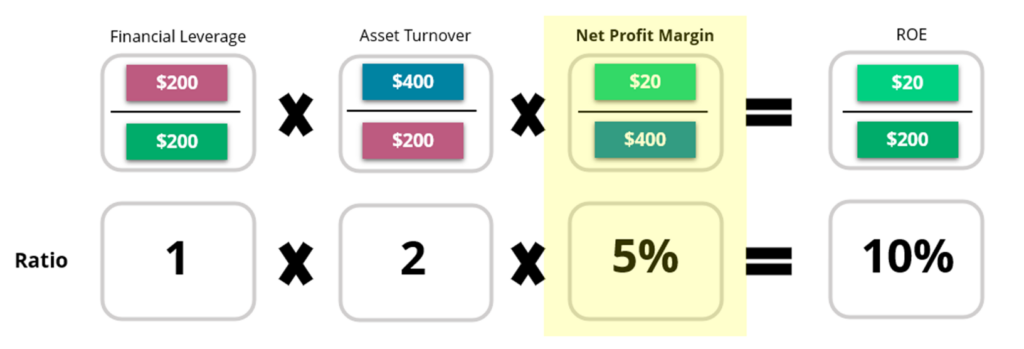
Net Profit Margin = 5% which leads you to ROE = 10%. Keep this in mind while we look at the next example.
Driver 2 : Increase Asset Turnover
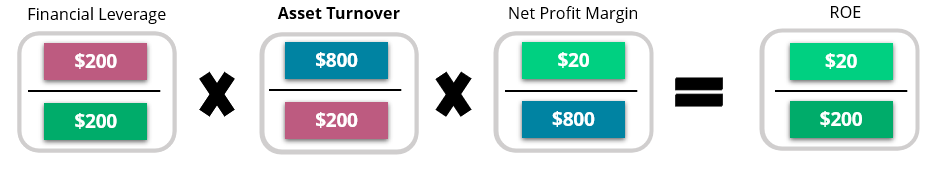
For the following example, we will utilize the figures as shown above.
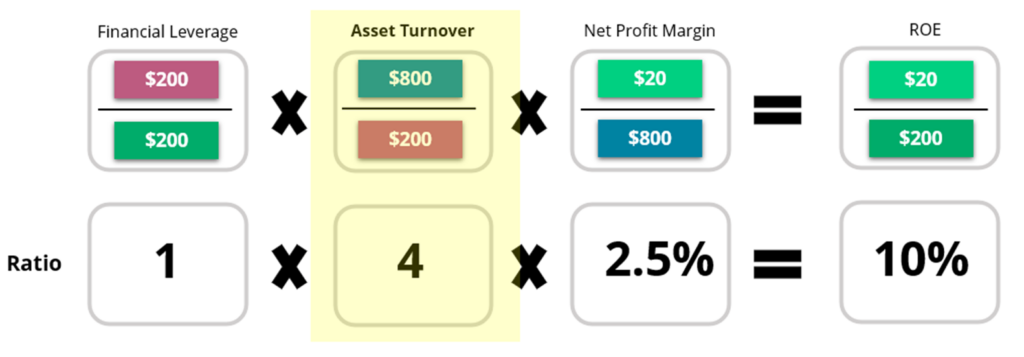
When Net Profit Margin drops to 2.5%, your Asset Turnover increases to 4x. Hence ROE remains at 10%.
Driver 3 : Increase Financial Leverage
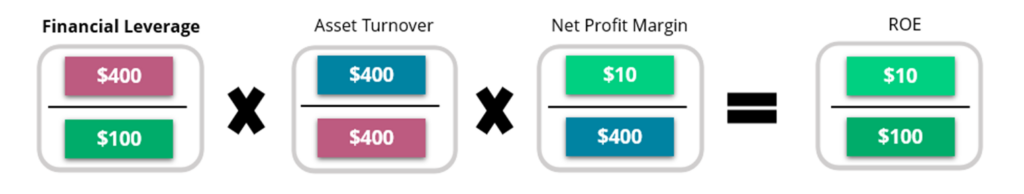
For the following example, we will utilize the figures as shown above.
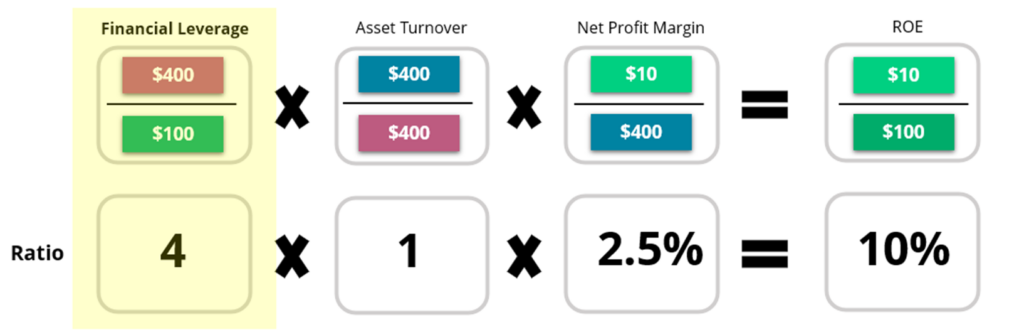
In this example, your Asset Turnover drops to 1x while maintaining a Net Profit Margin of 2.5%. However, as you have an increased financial leverage, your ROE maintains at 10%.
Determine Business models
Use Dupont Analysis to determine business models
Assuming that you are using your own money, this would lead us to a Financial Leverage of 1x, we will now see the how to differences in Asset Turnover and Net Profit Margin can aid us in determining the business model of the company.
Therefore, we can now look at these two components and see how they affect the ROE in different business models.
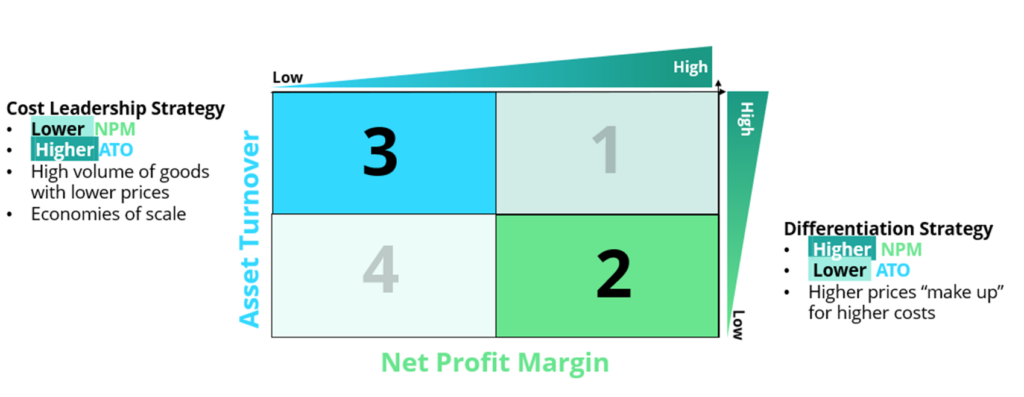
4 Scenarios of different business models
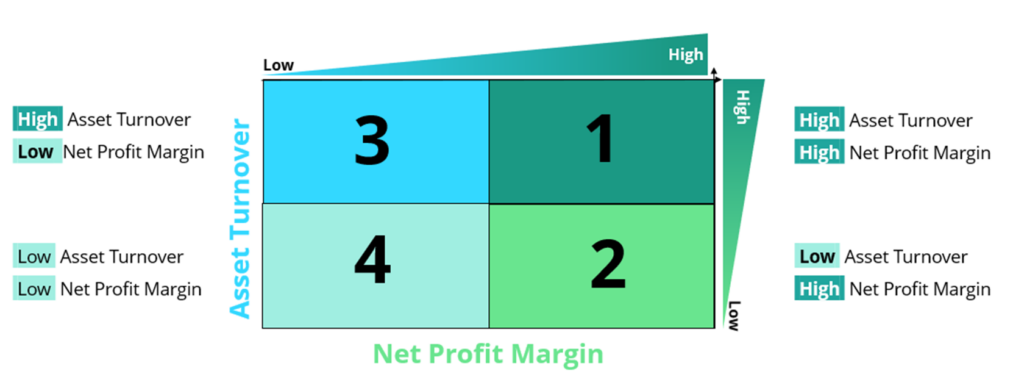
Model 1 : High Profit Margin , High Asset Turnover
The ideal model for businesses and indicates the business is performing exceptionally well
However, in real world we do not see a large representation of businesses with high NPM and high ATO
Model 2 : High Profit Margin, Low Asset Turnover
This could indicate industries where they operate with lower volume of sales but at higher prices (e.g., property, luxury goods)
They usually rely on an efficient pricing strategy to maximize their net profit.
Model 3 : Low Profit Margin , High Asset Turnover
Conversely, this could indicate certain industries such as retail or groceries where they operate with high volumes but low profit margins.
They generally rely on volume of sales at lower prices with efficient operations.
Model 4 : Low Profit Margin , Low Asset Turnover
In this instance, it indicates the company is failing and very likely will not survive for long.
Example of Companies from Different Industries
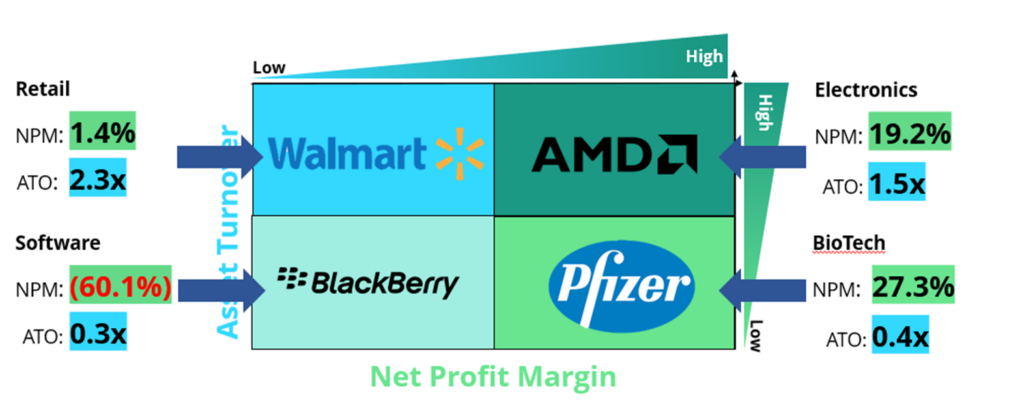
Business models from the lens of DuPont ROE
Competitive Strategy
Michael Porter’s Competitive Strategy
Porter’s strategies—cost leadership and differentiation bring structure to the task of strategic positioning. He shows how competitive advantage can be defined in terms of relative cost and relative prices, thus linking it directly to profitability.
Cost Leadership Strategy
- Create economies of scale through efficient operations
- High volume of goods sold at low costs
- Provide customers with lower prices
Differentiation Strategy
- Goods that are difficult to replicate with superior product quality
- Fulfills niche needs
- Sell products or services at a premium
Cost Leadership vs Differentiation in terms of NPM and ATO
Using Michael Porter’s two competitive strategies, Cost Leadership and Differentiation, which box would most likely be applicable for each strategy?