Daniel’s Dolphin and PACED
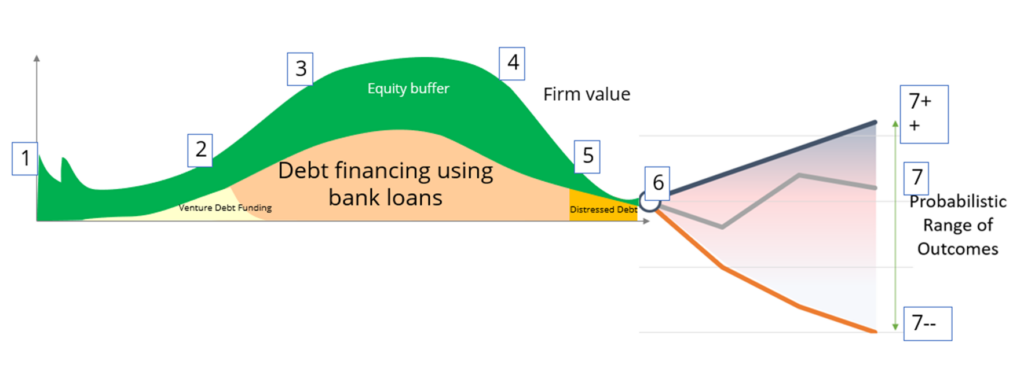
Daniel’s Dolphin and recovery?
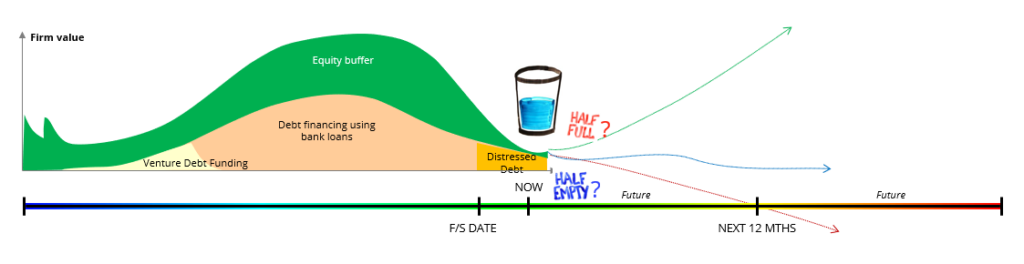
Half-filled glass – Half full or half empty?

For the same set of financials, company can be growing or declining. Where is it on the Dolphin?
Negative cash flows…How to decide if we are funding for growth or funding for losses?
- See the past and the future
- Has there been a downward/upward trend?
- Growth in sales vs growth in assets?
- Order book, upcoming projects, contracts
- Contract timing, contract value
- PIT: probability, impact, timing
- Look at business activity, volume of customers Operation Parameter Tracking
- Is company breaking even the fixed cost? Is (VR – VC) increasing such that is can cover fixed cost?
- Is the fixed cost growing too much that it exceeds the gross margin?
- How elastic are fixed costs and variable costs?
- Do they have a positive gross profit which is widening?
- Increases in revenue drivers? Reduction in cost drivers?
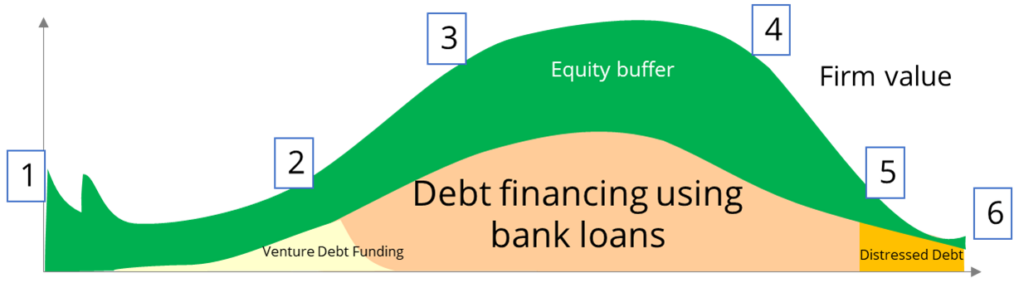
Combining Daniel’s Dolphin and the 4 Buckets of Time
DD – Life cycle of company
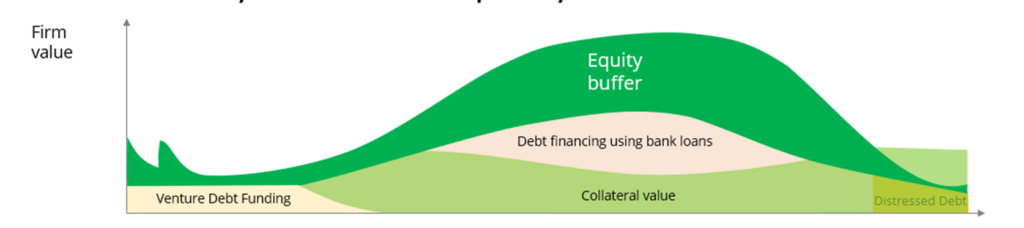
- Debt must be proportionate to equity (past + future CF)
- Debt falls before equity falls at mature/decline stage
- During decline/deteriorate stage, contingent liabilities are more likely to crystallise à cautious
The Business Curve – when should the bank lend?
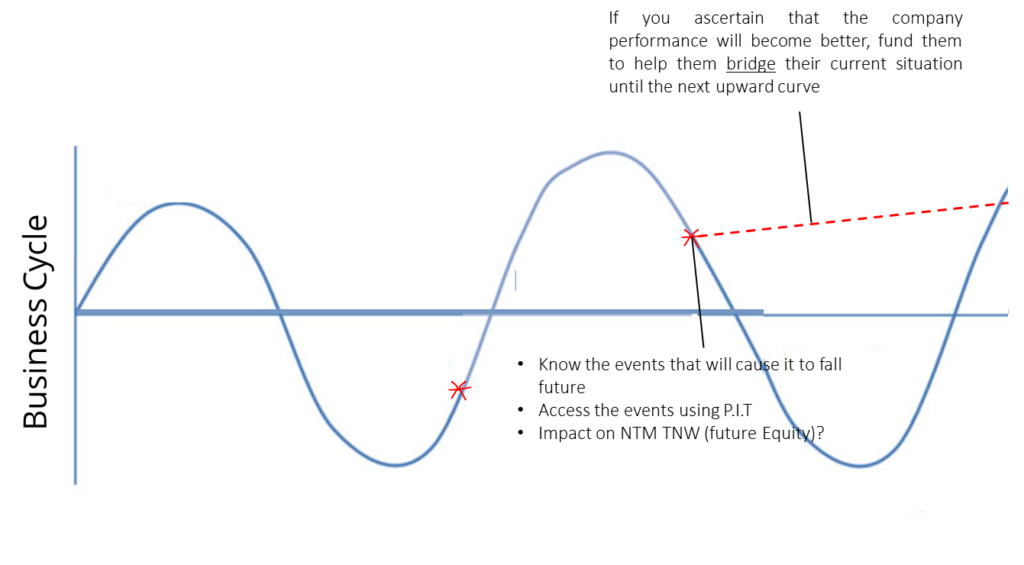
In general, a company with more years of operations (under the same promoter) may reflect that the company has survived many business cycles
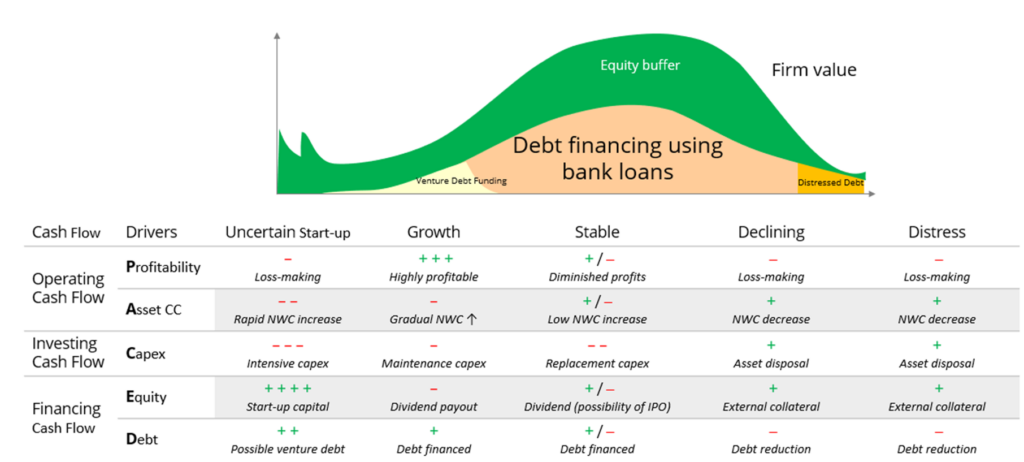
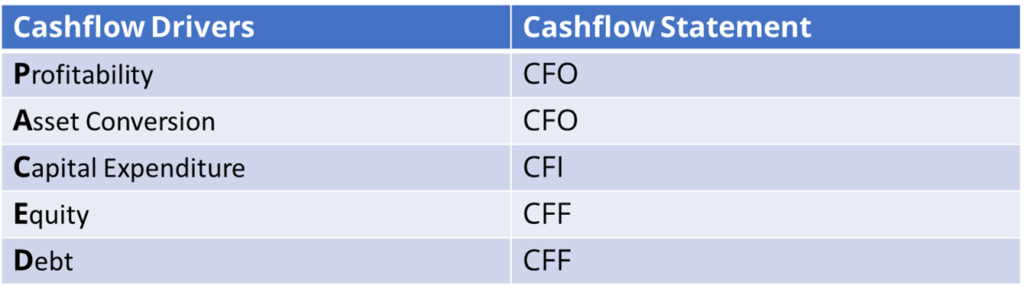
Analyzing Credit with the PACED framework…
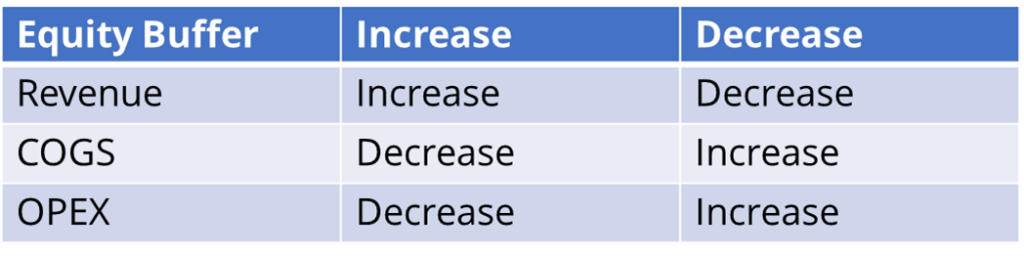
- PACED framework facilitates the analysis of a firm’s equity buffer through cashflow drivers
- Are you funding for growth or are you funding for losses?
- Core vs. Non-core
Profitability
Look at Gross Profit as the first cut then accounting items that affect equity buffer– how positive is it in order to cover operating costs (look at the trend of absolute number rather than margin)
Is the cash portion of GP large enough to cover the cash portion of expenses?
Revenue must be quantifiable. Consider the following:
- Can the firm’s long term contracts be renewed?
- How sticky is the firm’s customer base (cost-benefit analysis for clients)
Look for possible asset impairments (i.e. AR): (1) is it a one off default? (2) single outlier? (3) is it industry practice to have long AR DOH?
- Compare AR listing and look at each company transaction across months identify AR provision MoM
- Is there a pattern in the single AR list (Materiality relative to Equity Buffer)
- Are there changes across AR lists?
- 6 correlation attributes of AR ageing: Debtor, Industry, Geographical, Currency, Credit Rating
Profitability – Elasticity
- Traditionally, revenue should be more elastic than COGS
- As mentioned earlier, cost management is a better sign of management capability
- Elasticity of expenses – an example: Directors Compensation vs. Personnel Costs
- At first glance, directors’ compensation looks to be much more elastic that personnel costs but what if the company is made up mostly of contract staff?
- If the firm has a trend of losses
- Calculate how much of its expenses it has to cut
- Identify if there are areas where discretionary costs can be cut.
- However, do not lose focus on the cutting costs and its effect on UEA.
Five Key Cash Flow Drivers & Ratios
| CF drivers | Financial Ratios | CF statement | Considerations |
|---|---|---|---|
| Profitability | Revenues and Profitability • Sales growth • EBIT (DA) and Gross Margins • Interest Coverage | Operating CF : Cash Profit | •Operating margins •Tax •Sales – Volume & Unit Price |
| Asset Conversion | Asset Management • Net Working Assets / Sales • Turnover ratios | Operating CF : ∆ NWC | •Volume of Sales •Time •Price |
| Capital Expenditure | Asset Management • Physical Asset Utilisation • Gross Capex (PPE) / Depreciation | Investing CF | • Non-discretionary vs discretionary capex • Time delay / cost overruns • Completion risk • Impact on volume & margins |
| Equity | Leverage and Debt Capacity • Net Worth (Tangible) / Total assets • Current / Quick ratios | Financing CF | • Access to capital • Cost of equity |
| Debt | • Debt**/ EBITDAR • Debt / (Tangible) Net Worth | Financing CF | • Cost of debt – interest • Debt maturity profile • Cash financial FX losses • Access to debt markets • Contingent liabilities |
Moody’s PACED: cash flow drivers
*Financial charges
**These ratios need to be adjusted for off balance-sheet and other liabilities
| Key Drivers | Primary Ratios | Secondary Ratios | |
| Profitability | • Volume of sales • Sales price • Operating margins • Tax | • Sales growth • EBIT margin • ICR = EBIT/ interest expense | • Gross profit • EBITDA margin |
| Asset Management | • Volume of sales • Time • Pricing | • Net working assets/ sales | Turnover ratios • Days payable • Days inventory • Days receivable |
| Capex | Mandatory capex: • Time delay • Cost overruns • Completion risk • Impact on volume and margins • Discretionary capex | • Physical assets utilization | • Gross capex (PPE)/ depreciation |
| Equity | • Access to capital • Cost of equity – dividend policy* | • Net worth/ total assets** | • Quick ratio • Current ratio • Tangible net worth/ total assets** |
| Debt | • Cost of debt – interest* • Debt maturity profile* • Cash financial FX losses* • Access to debt markets • Contingent liabilities | • Operating cash flow/ debt** • Debt**/ EBITDAR | • Debt/ tangible net worth |